


A workforce operations dashboard should measure task coverage, quality and service risk using the smallest set of work events needed. Desktop activity is an unreliable substitute for useful output. People-impacting interpretations need managerial review, relevant context and a way for workers to challenge an error.
Composite reference architecture. A reference operating model; no workforce monitoring deployment or productivity result is asserted.
The operating problem
Partners need capacity, quality and SLA visibility, but raw desktop monitoring creates privacy, labour and gaming risks. The useful unit is a work event tied to a task and policy, not continuous observation of a person.
How the workflow works
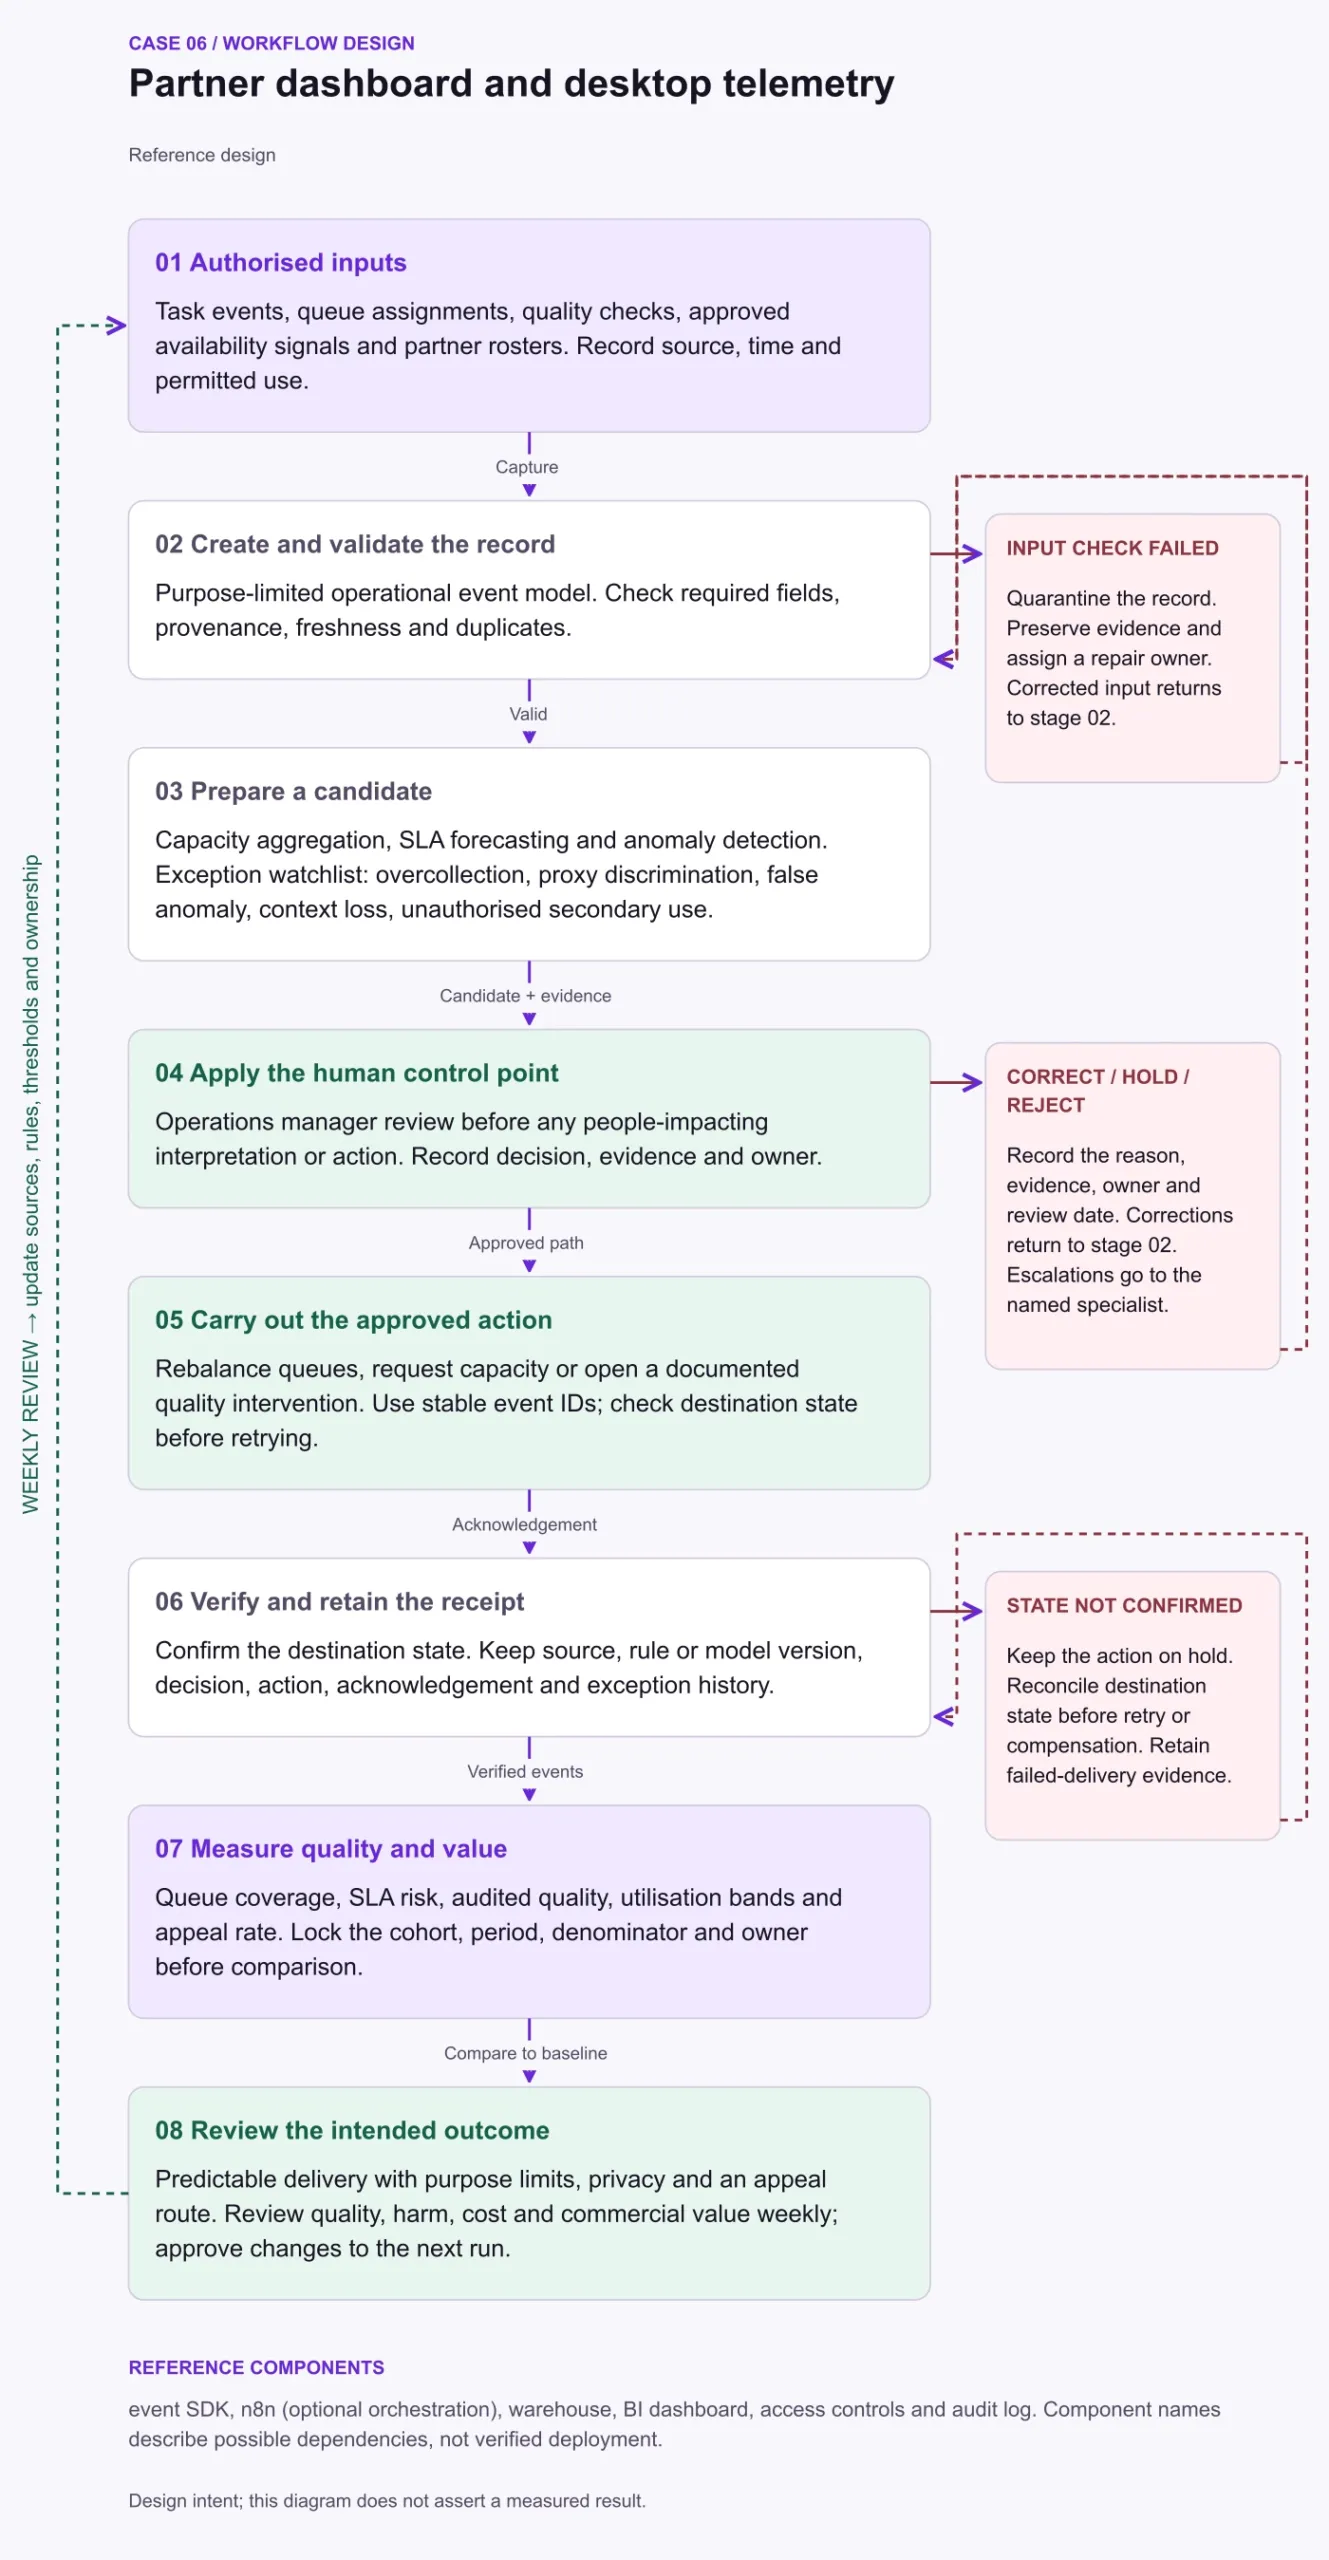
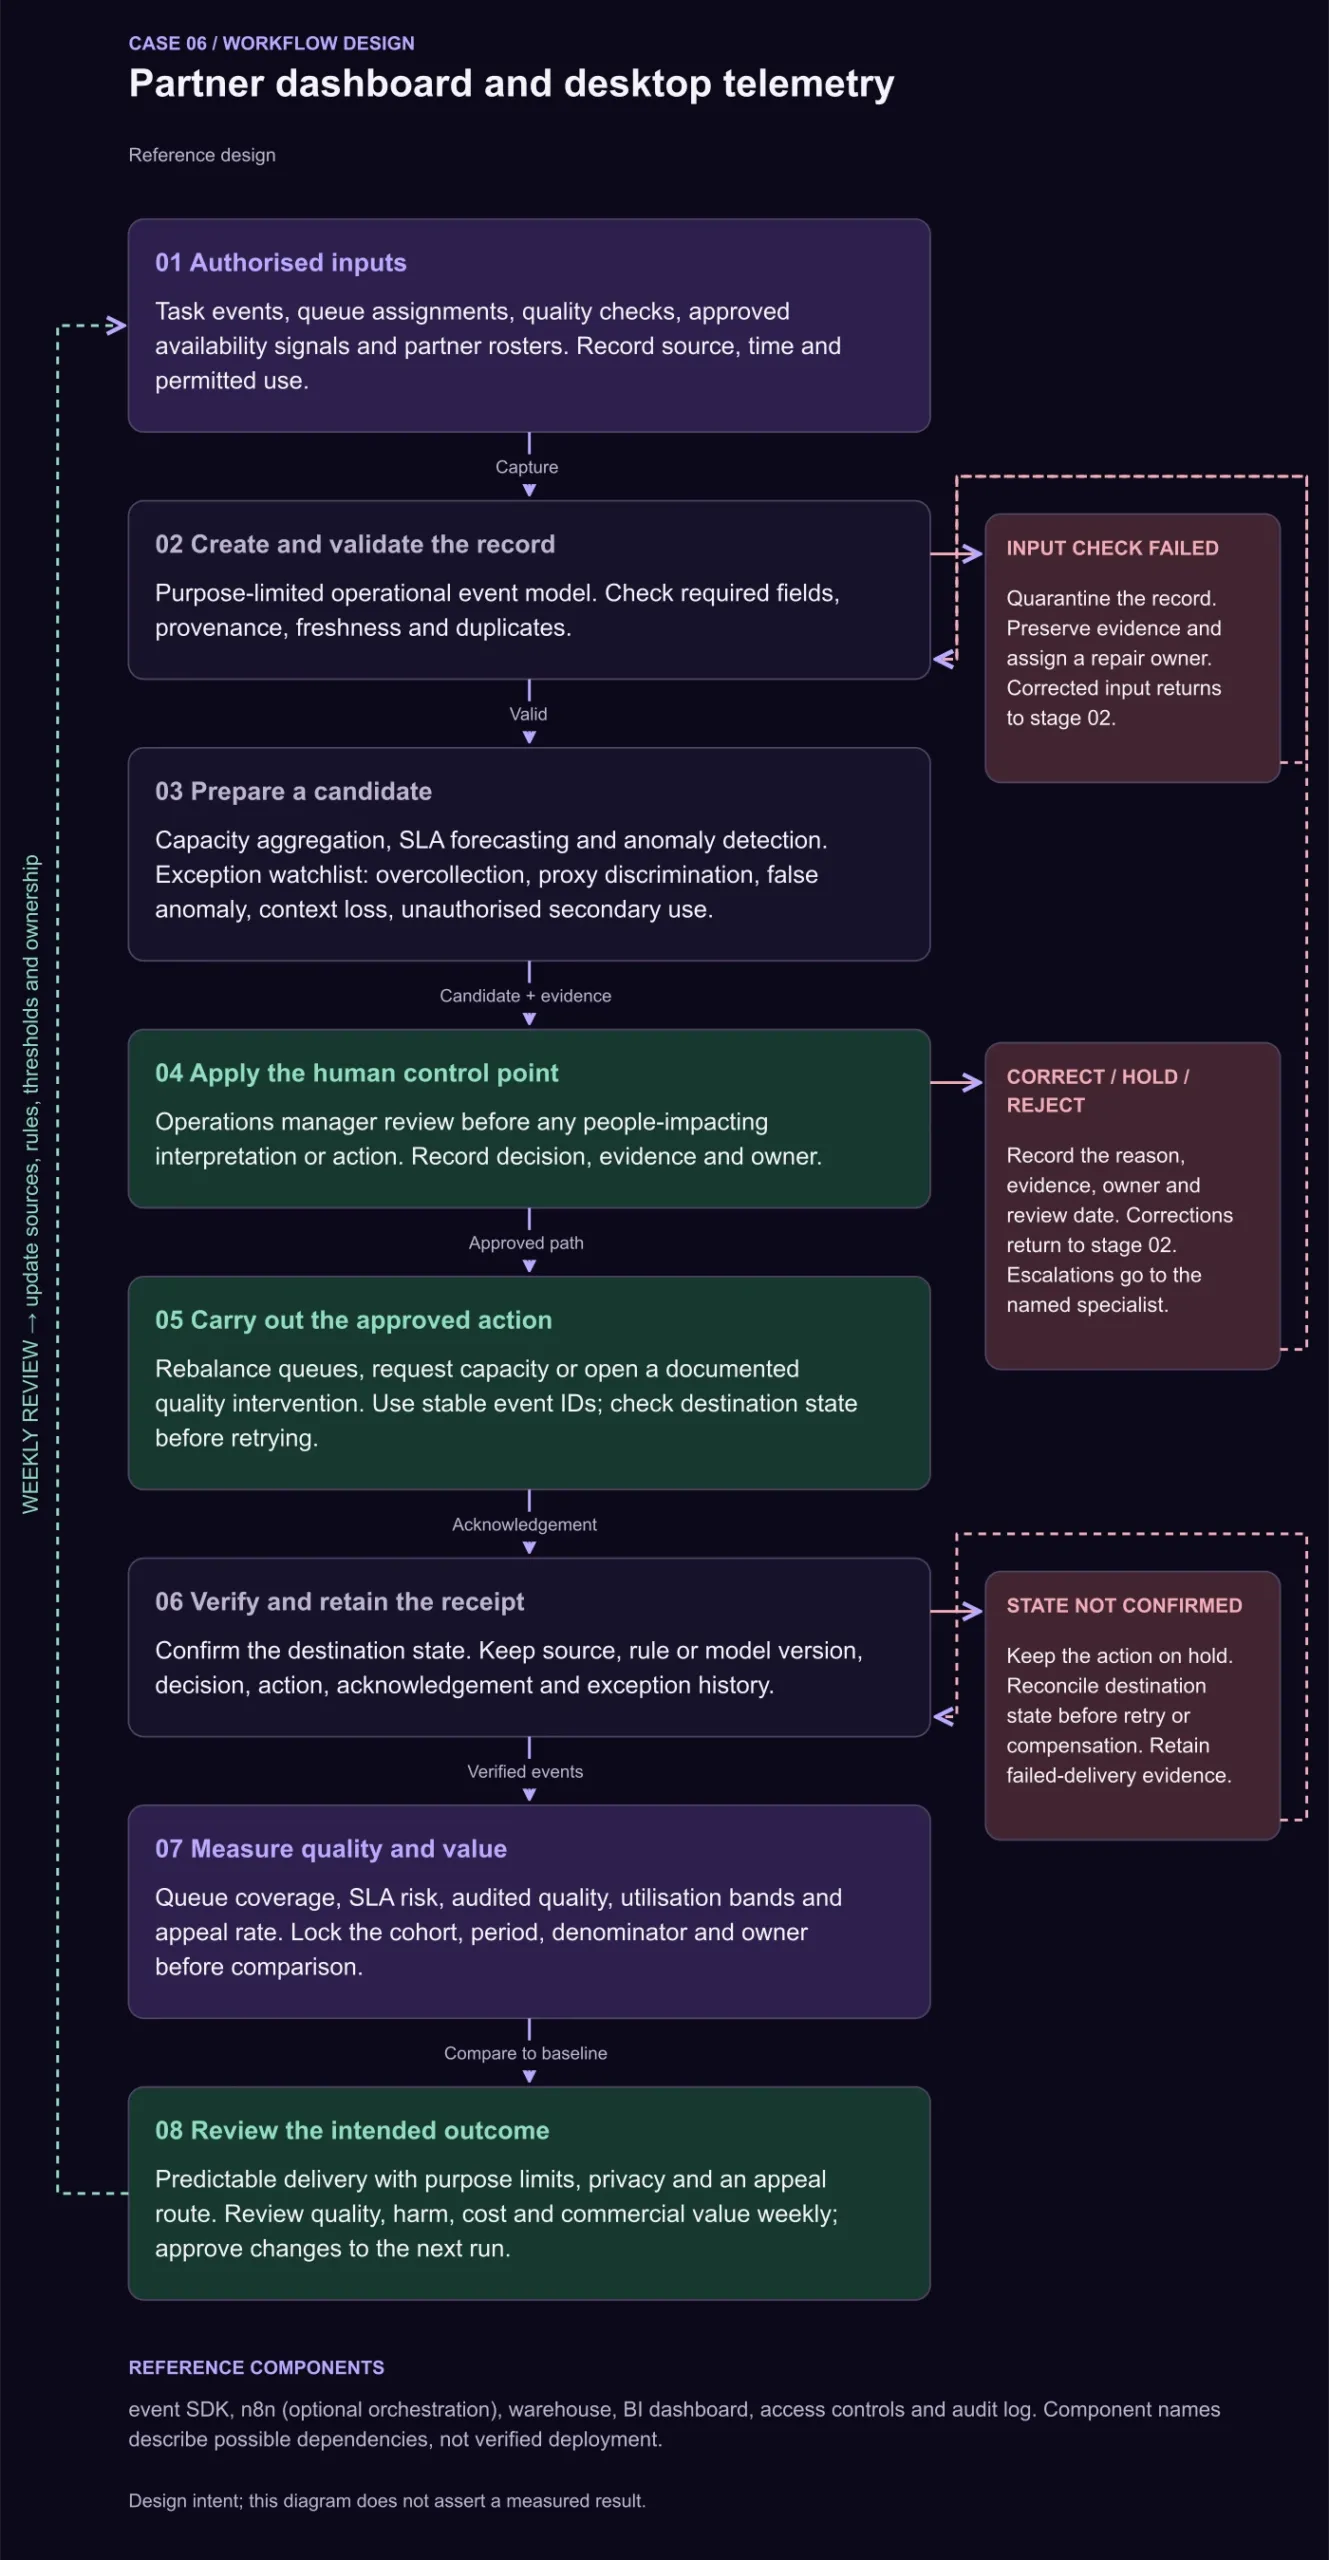
Define the operational event before choosing telemetry. Queue assignment, task completion, sampled quality and approved availability can show whether a delivery commitment has enough capacity. Aggregate these events by a useful operating cohort, restrict access and retain them only for the stated purpose. Avoid treating idle time or application activity as a direct productivity score.
Where review and controls matter
An anomaly is a prompt to investigate. Managers should examine task complexity, approved breaks, system outages and missing events before changing an assignment or opening a quality intervention. Overcollection and secondary use create risks the dashboard cannot solve through a consent checkbox. Employment and privacy owners must approve the intended use, access and retention rules for the relevant jurisdiction.
Risk reference: NIST AI RMF.
What to measure
Use a fixed cohort and measurement window. Count numerator events only within the denominator's eligible cohort; sampled measures use the same audit sample for both terms. Record the source, exclusions and owner, and keep missing data visible. These definitions are proposed measurement contracts, not observed results.
| Measure | Definition and unit |
|---|---|
| Queue coverage | Required skill-and-shift capacity covered by verified available workers divided by required capacity; percent, in declared hours or seats. |
| SLA risk | Open tasks forecast to miss their deadline divided by open tasks with deadlines; percent. Report subsequent forecast calibration. |
| Audited quality | Sampled completed tasks that pass the approved quality rubric divided by sampled completed tasks; percent, with sampling method. |
| Utilisation bands | Assigned productive task hours divided by approved available hours for the cohort; percent. Define excluded leave, training and downtime. |
| Appeal rate | People-impacting decisions challenged through the appeal process divided by such decisions; percent. Report upheld and overturned appeals separately. |
A useful first pilot
Start with queue events and sampled task quality for one delivery process. Compare the dashboard's risk flags with manager review, including outage and missing-data cases, before using them for capacity decisions.
Bring the workflow, its source records and the decision that needs an owner to a BergLabs pilot discussion.
